![]()
By Ron Buck
Today, every bank and credit union is in some stage of branch transformation. They are re-designing branches, re-staffing branches, re-sizing branches, re-purposing branches and introducing new technology to provide more services in support of the digital channels. These initiatives constantly require the balance of cost (expense) reduction and sales performance improvement (revenue growth).
Any bank executive who has been involved in this balancing act knows that reducing costs too much (or too little) will have serious ramifications on branch profitability or branch efficiency. After all, there are only two levers in this balancing act.
Branch Profitability = Revenue – Cost
Branch Efficiency Ratio = Cost/Revenue
Reducing staff through attrition or scheduling can have a negative impact on revenue if your models are not dynamically driven by sales metrics. On the other hand, adding staff to increase sales can be tricky as well. Branch performance in an era of transformation certainly requires a more balanced approach.
Figure 1.0 illustrates the traditional approach to branch staffing – the relationship between your Staffing Efficiency Ratio (cost/face-to-face meeting) and Face-to-Face Meeting/FTE/Day.
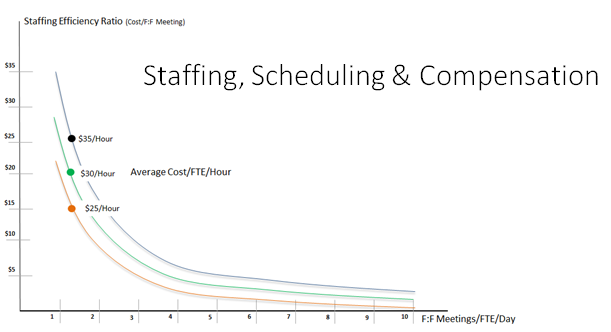
Figure 1.0
The fully-burdened cost of a personal banker in a rural market may be less than $25/hour, $30/hour in a suburban market and $35/hour in an urban competitive market for more senior staff. Reducing head count increases the number of Face-to-Face Meeting/FTE/Day and improves the Staffing Efficiency Ratio (cost/face-to-face meetings).
Figure 1.0 illustrates the traditional approach to branch staffing that is focused on getting the ‘right number of people at the right place at the right time’. Our experience has helped us develop a new model that improves both branch profitability and the branch efficiency ratio by getting the ‘right number of people and the right people at the right place at the right time’. This is a subtle but important difference.
Figure 2.0 illustrates that branch metrics that matter. 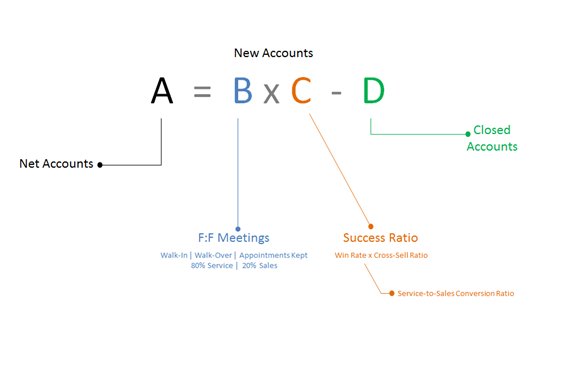
Figure 2.0
This simple equation states that ‘Net Accounts’ equals ‘New Accounts’ minus ‘Closed Accounts’. It also illustrates the two drivers of new accounts – Face-to-Face Meetings and Success Ratio (new accounts per face-to-face meetings). This is a very simple but very powerful equation.
In an era of transformation, over 80% of face-to-face meetings are service-related and less than 20% are sales-related. With a cross-sell of 1.25 (national average), a typical Success Ratio is about 0.25 new accounts/face-to-face meeting (0.65 for high performers).
Figure 3.0 illustrates the relationship of Success Ratio and Face-to-Face Meetings. Every personal banker has a ‘workload capacity’ – the point when a personal banker is having so many face-to-face meetings each day that the success ratio begins to decrease. Our research indicates that optimized ‘workload capacities’ range from 5 to 8 Face-to-Face Meetings/FTE/Day.
Figure 3.0 also illustrates the impact of ‘workload capacity’ on the Branch Efficiency Ratio – the cost to generate revenue divided by the revenue generated.
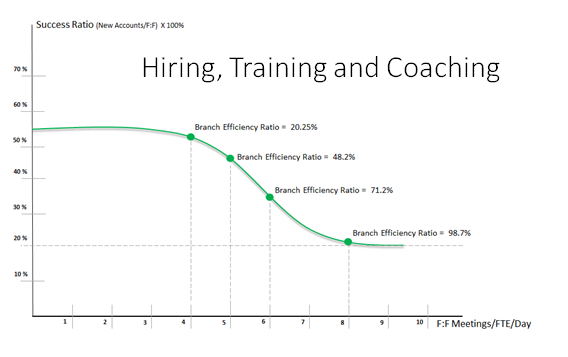
Figure 3.0
Figure 4.0 illustrates the ‘workload capacity’ curves for four different branches all staffed at 7 Face-to-Face Meeting/FTE/Day. On the surface, it may seem that staffing has been optimized but a closer look shows that the four Branch Efficiency Ratios vary from 51.5% (admirable performance) to 88.7% (poor performance).
Branch 2 should be staffed at 5 Face-to-Face Meetings/FTE/Day and Branch 3 should be staffed at 6 Face-to-Face Meetings/FTE/Day.
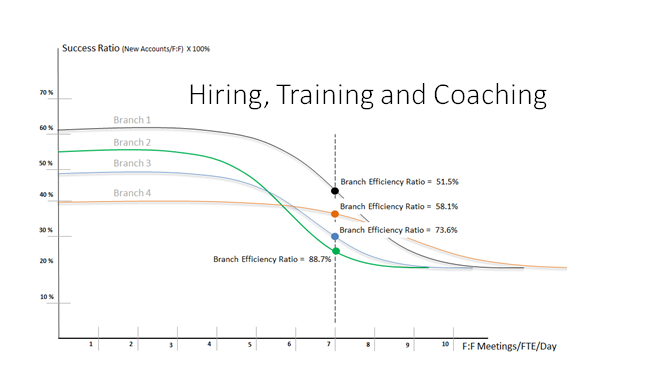
Figure 4.0
Figure 5.0 illustrates St. Meyer & Hubbard’s ‘branch scorecard’ that our clients use for a more balanced approach to branch performance – where staffing models are dynamically driven by the branch Success Ratio to simultaneously optimize branch revenue and the branch efficiency ratio.
The ‘branch scorecard’ is part of the Branch Optimization Playbook that is used for a more balanced approach to branch performance. The ‘branch scorecard’ includes national benchmarks from over 10,000 branches and can be filtered by region of the US, market, branch size and branch age. The ‘branch scorecard’ includes interactive ‘what-if’ scenario planning tools that can be used to balance cost and revenue. The Branch Optimization Playbook includes the best practices of high performing banks – as measured by branch profitability and branch efficiency ratio.
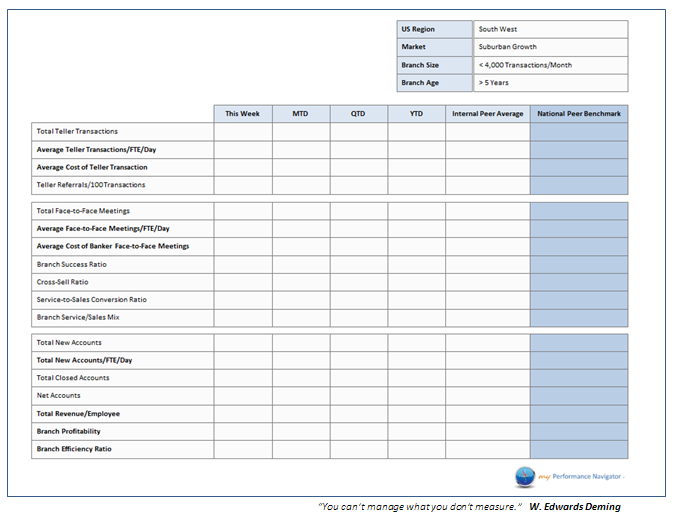
Figure 5.0
If you are interested in learning more about St. Meyer & Hubbard’s Branch Scorecard and their ‘Branch Optimization Playbook’ contact Ron Buck at:
Inquiry: Branch Optimization Playbook
480-212-6082